What is sell-through? How retailers use it to make better buying decisions
Every product on your floor is either moving or sitting. Sell-through tells you which. This guide covers how to calculate it, how to read the number by category, and how to turn it into smarter reorders.
- Sell-through is the percentage of inventory you sell within a set period. It shows which products are moving and which are sitting.
- To calculate it, divide units sold by units received and multiply by 100. Use the same time window for every product you compare.
- Read each result against a target set before the product arrives, and compare products within a category, since accessories and jewelry move faster than home decor.
- Rank products by sell-through to find fast and slow movers, then check each color, finish, and size before deciding what to reorder.
- Check sell-through weekly to time replenishment against your lead time and catch slow movers before they need a markdown. With no minimums, you can reorder only the versions that sold.
You make the buying decision for every product on your floor. And every decision proves itself through stock that moves or stock that sits. Sell-through, or the percentage of inventory sold within a period, tells you which is which. This, in turn, helps you make informed buying decisions when it comes to replenishment, or the decision to restock products during the season.
In short, sell-through is one of the most important retail performance metrics to track because it tells you what your customers are actually buying off your shelves. The following will help you understand sell-through in retail, how to calculate it, and how to use it to make informed buying decisions.
What is sell-through and why it matters

Sell-through shows retailers how fast products move and how well buying decisions are working. It does this by comparing what you bought with what your customers bought from you. For example, if you ordered 100 units of a product for the month and sold 60, your sell-through rate is 60% for that month.
The catch is that a product can have strong sales numbers but a weak sell-through, which indicates that you overbought. On the other hand, a product with modest sales can have a high sell-through because you bought close to the right amount.
It’s all a balancing game with a high price tag if you get it wrong. IHL Group’s 2026 Inventory Distortion Study puts the combined cost of overstocks and out-of-stocks at $1.7 trillion in 2026, or 6.2% of global retail sales. Tracking sell-through per product is one of the most direct ways to spot that imbalance before you have to mark products down.
How to calculate sell-through
To calculate sell-through, you need units sold and units received. You also need to set the time period. It can be a week, a month, or a whole season, but use the same time period for every product you’re comparing. The simple sell-through formula is:
(Units sold ÷ units received) × 100 = sell-through (%)
For example, say you receive 80 pairs of earrings on the first of the month and sell 52 by the end of week four. That is (52 ÷ 80) × 100, or 65% sell-through for the month.
You don’t have to use units, although they’re the easiest. You can also use dollars, which will give more weight to higher-ticket items.
Calculate your sell-through
Enter what you received and sold in the same time window, plus the target you set before the product arrived.
On or near your target. You bought close to the right amount for demand.
How retailers use sell-through to evaluate product performance
A short-term sell-through of 65% is a strong retail performance metric, but if that number covers six months or a year, it’s a weak signal. Sell-through shouldn’t be the only factor. Use it alongside other variables to measure the strength of a product. We’ve already covered the time window, but also read it against comparable products and the product’s merchandising. A product tucked in the back of the store by the bathrooms won’t get the same face time as something on the front display.
How to interpret sell-through percentages
Different products from different categories won’t have the same sell-through rate. For example, a product in your accessories category will reach 50% sell-through faster than a product in your home decor section. So you have to set your expected sell-through and time frame for each product individually before it arrives. Then you can read each result against its target using the following:
- 100% or close, early in the window: You can’t sell beyond 100%, so if you run out of stock before your window closes, you didn’t order enough to meet demand or to get a good read on sell-through.
- On or near your target: This is a good sign that the product is doing what you expected and that you read the signals correctly and bought the right amount to meet demand.
- Well below your target: The product isn’t selling the way you predicted, and you overbought.
- Percentage direction: A product that sells strong early but then tapers off isn’t as reliable as one with a steady sell-through week after week.
Category-level sell-through expectations

Because different categories sell at different rates, a strong sell-through for one category won’t be strong for another. Compare products within categories, not across them. Here is generally what you can expect from popular categories:
- Accessories tend to turn quickly, with lower price points and frequent repeat purchases. You can read a new style quickly, usually within a few weeks.
- Jewelry varies even within the category. Everyday pieces move faster than high-end pieces, so compare them accordingly.
- Home decor is a slower-moving category than accessories or jewelry. The pieces are generally bigger and purchased less often, so this category needs a longer time frame than a few weeks.
- Novelty items are tied to a moment or a theme and sell fast at first, then drop off. This category does best when you read it on a short window and don’t expect much recovery from a weak early sell-through.
How sell-through improves retail buying decisions
When read correctly, your sell-through tells you how your products are performing. Use these results to build your next order.
How to identify fast movers and slow movers
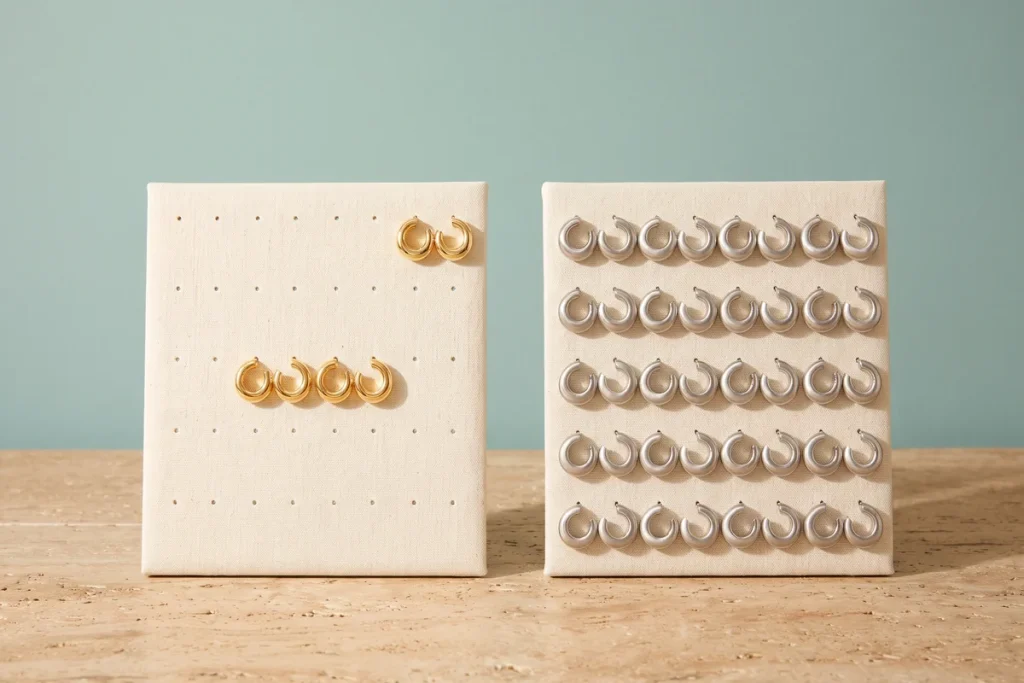
A fast-moving product is one with a high sell-through for its time frame and category. Dig a little deeper here and see whether it’s selling fast at full price, or whether a promotion pushed it faster. If it sold out, it could be hiding even higher demand than your numbers show.
On the other hand, a slow-moving product has a low sell-through. Is it a style that is selling fast overall, while that particular color, finish, or size isn’t? What about its location in the store?
Rank your products in each category by their sell-through within the same time window. This will help you sort the fast movers from the slow movers.
How to adjust buying based on sell-through
Knowing your fast movers and slow movers helps you shape your next order. For fast-moving products, decide whether you need more sooner than your regular replenishment order, and how much to order. Studying your product data will help. A product that sells out in week two calls for a different next order than one that sells out in week eight.
When it comes to slow movers, the next order can shrink, shift to a version that did sell, or stop altogether. This is where you’ll study every color, finish, and size of a product. If just one version didn’t sell through, you can still order the versions that did.
How to use sell-through for replenishment and risk reduction

You can use a product’s sell-through to decide when to place a replenishment order. Check sell-through weekly to catch both the products that need restocking and the ones that are falling behind. Time each restock based on the current sales pace and your lead time, the gap between placing an order and receiving it. The goal is for the restock to arrive before the product sells out.
By checking sell-through early, you can catch slow movers and respond before they need a markdown. You can respond in several ways: place a smaller order, hold the next order, or don’t reorder at all.
How Everful’s factory-direct consistency supports accurate sell-through

Sell-through is only as reliable as the product behind it. If you place a reorder and it arrives in a different finish or a slightly different color, then you’re selling a different product. You lose the information you’ve been collecting and can no longer tell whether a change in the number came from demand or from the stock itself.
Everful is factory-direct, which means you buy directly from vetted manufacturers, and every order is hand-inspected before it ships. Each order is checked for consistent materials, construction, color, and size against what you ordered. You’ll also have one accountable source from order to post-sale, so products stay consistent from order to order. And with no minimums, you can reorder exactly the versions that sold. With Everful, if your sell-through shifts, the shift comes from demand rather than the product itself.
Common questions about sell-through
What is a good sell-through percentage?
A good sell-through rate depends on the category, price point, and time frame you’re measuring, so there’s no set percentage that fits every product.
How often should retailers check sell-through?
Check sell-through weekly for fast-moving categories like accessories and jewelry, and for any product you plan to restock. Slower-moving categories like home decor can go longer between sell-through checks.
How is sell-through different from inventory turnover?
Sell-through measures specific products against a set time period, which helps you make individual buying and reorder decisions. Inventory turnover is a broader measure of your overall inventory over a longer period, like a year. It measures how many times your inventory sells and is replaced, showing how well your inventory is working overall.